FACTIVITY releases new RS metrics
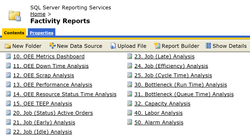
FACTIVITY has just released RS METRICS, a new set of metrics that allows manufacturing management a tool to drill down into data and find ways to improve the their manufacturing floor’s production process. RS METRICS creates analysis reports of Key Performance Indicators (KPI) that go beyond the standard set of OEE measurements of availability, performance and quality.
“Classic OEE measurements of machine up and down time is simply not enough to identify the root cause of problems on the factory floor,” said John Leibert, President, FACTIVITY. “So, we developed a system that could provide stronger solutions.”
“Although displayed in real-time through a score board type of view, sometimes other vendors dashboard metrics often are lacking detail data elements that can help focus on the reasons for problems,” said Tim MacCollum, Lead Consultant for this FACTIVITY project. “We felt that using Microsoft’s SQL Reporting Services would be a great way to show the underlying data captured by FACTIVITY Shop Floor Workbench,” he said.
Shop Floor Workbench is FACTIVITY’s key software product that provides manufacturing facilities with a user-friendly way to view real-time WIP tracking, better manage materials and improve production control. The product is entirely customizable and enables factories to utilize paperless functionalities.
RS METRICS can be a great asset to management involved with lean manufacturing a well as an invaluable tool for value steam mapping of a factory floor.
The full list of new analytic reports available includes:
1. OEE Metrics Dashboard
2. OEE Down – Problem Analysis
3. OEE Scrap Analysis
4. OEE Performance Analysis
5. OEE Resource Status Time Analysis
6. Job (Status) Active Orders
7. Job (Early) Analysis
8. Job (Idle) Analysis
9. Job (Late) Analysis
10. Job (Efficiency) Analysis
11. Job (Cycle Time) Analysis
12. Schedule (Load) Analysis
13. Scheduled Bottleneck (Run Time) Analysis
14. Scheduled Bottleneck (Queue Time) Analysis
15. Labor Analysis
16. Production Analysis
17. Alarm Analysis
“We felt that by using the power of the drill down in this pervasive and easy to use reporting tool, FACTIVITY could help manufacturers focus in on the root cause of problems captured in real-time by our SF Workbench software,” said MacCollum.
For example, the new release features two (2) Bottleneck Analyses can be a helpful complement to data found in a good quality OEE metric. The two new Bottleneck metrics show the amount of time work to be worked at the resource. But it is measured and displayed in two very different ways. The Run Time Analysis shows the amount of total scheduled production hours waiting to run at a resource broken down by job number or what FACTIVITY refers to as ID Number. The Queue Time Bottleneck report shows the amount of time Jobs have been waiting at a resource broken down into the waiting time from time of release into production until it starts actual work and the amount of wait time between each resource.
Companies that make pieces and parts in a discrete manufacturing process will find these new metrics of great help. “If your factory’s concern is better product flow through the production process, then queue time is the metric to focus on,” Leibert said. “This metrics identifies bottleneck operations (machines and work areas) to shrink the time from job release to finished goods. And if bottleneck identification is your key to success, then this is the measurement for you. However, if you know your bottleneck, and now your major measurement of success is moving product through a specific machine or work area, then knowing the amount of scheduling time might help you determine the best way to sequence the work for the best on-time delivery.”


