September 2024 Logistics Managers’ Index
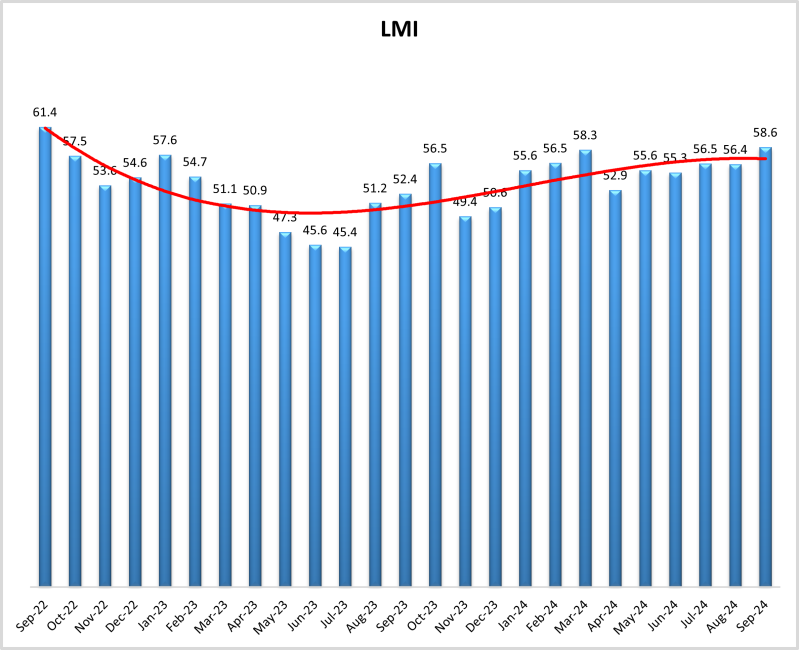
The September Logistics Manager’s Index reads in at 58.6, up (+2.2) from August’s reading of 56.4 and at its highest level since two years ago in September 2022. The overall index has increased for ten consecutive months, proving the logistics industry is back on solid footing. We saw a continuation of August’s trends in September as Inventory Levels increased (+4.1) to 59.8. The long-expected restocking of Downstream retailers primarily drives this. After several months of contraction, Downstream respondents are reporting expansion for Inventory Levels at a rate of 55.7. This represents some modicum of relief for Upstream supply chains, where goods had been building up like rainclouds waiting for the eventual downpour that retailers anticipate as we move into Q4. This shift is reflected in the significantly higher rates of Downstream Warehousing Prices (75.0 to 64.9 Upstream) and Transportation Prices (68.3 to 55.1 Upstream), signaling that retail supply chains are whirring back into motion for peak season. The fact that peak season is happening at all should be a bit of a relief for the logistics industry – and the economy as a whole – since we have not seen a traditional seasonal peak since 2021 (or possibly even 2019, if you don’t consider 2020 or 2021 to be “normal”). This activity resulted in Transportation Capacity moving back down to 50.0 and “no movement,” the second time that happened in 2024. Overall Transportation Capacity has not contracted since March of 2022. However, it is currently contracting at the Downstream level (45.0) due to the movement of goods from vendors down to retailers. It will be interesting to see if the current trajectory continues and it moves back to contraction at any point in Q4.
Researchers at Arizona State University, Colorado State University, Rochester Institute of Technology, Rutgers University, and the University of Nevada, Reno, in conjunction with the Council of Supply Chain Management Professionals (CSCMP), issued this report today.
Results Overview
The LMI score combines eight unique components that comprise the logistics industry, including inventory levels and costs, warehousing capacity, utilization, and prices, as well as transportation capacity, utilization, and prices. The LMI is calculated using a diffusion index, in which any reading above 50.0 indicates that logistics is expanding; a reading below 50.0 indicates a shrinking logistics industry. The latest results of the LMI summarize the responses of supply chain professionals collected in September 2024.

The LMI read in at 58.6 in September, up (+2.3) from August’s reading of 56.4, its highest level in two full years. While this is the 24th consecutive reading below the all-time average of 61.8 for the overall metric, the current trajectory suggests that may not be the case for much longer. This reflects the overall economy, which has recovered throughout 2024 and appears poised to expand more forcefully in 2025. Inflation continued to cool down in August, with PCE slowing to 2.2% year-over-year inflation, down 0.3% from July and close to the Fed’s long-term goal of 2% inflation. This number has led some analysts to suggest that the Fed will cut rates again in 2024[1]. The University of Michigan’s Consumer Sentiment Index increased to 70.1 at the end of September, up (+3.2) from August’s reading of 67.9. Forward look sentiment was also up (+2.3) to 74.4 in late September[2]. The percentage of U.S. households below the poverty line was down, and incomes were up 4% in 2023 to $80,610 per household. With this increase, household incomes are nearly on par with their all-time high reading of $81,210 in 2019 before the pandemic[3]. While this is a positive sign for consumers, it should be noted that these are raw numbers and not adjusted for inflation. The fact that U.S. incomes are still not quite back to where they were four years ago demonstrates just how long the economic hangover of COVID-19 has been.
This positive economic data contributed to increases in all of the major U.S. stock indices in the last week of September, with the S&P 500 and the Dow, respectively, marking their 42nd and 32nd record high closes of the year[4].As has been the case for most of the last year, the outlook in other parts of the world is more complex and, in many cases, less optimistic than in the U.S. For instance, inflation also declined in France and Spain in September, likely leading to further rate cuts in the EU[5]. Germany has displayed mild improvement in consumer climate but continues to recover more slowly than analysts had anticipated [6]. This is reflected in the European Commission’s aggregate measure of business and consumer confidence, down 0.3% month-over-month, sliding slightly in the post-Olympics period[7].
There were some signs of life in China. In the last week of September, Chinese regulators put forth an economic stimulus package that included interest rate cuts, an allowance for smaller down payments on mortgages, and increased lending rates for firms engaging in stock buybacks. As a result, the Chinese CSI index increased by 15.7%, its most significant weekly gain since 2008[8]. The stock buybacks may be a temporary sugar high, so it will be interesting to monitor the long-term growth of this stimulus package for the world’s second-largest economy. Finally, closer to home, Canada’s GDP was flat in August, following a slight 0.2% uptick in July that had led some analysts to hope the Canadian economy was picking up steam[9]. This has led Bank of Canada officials to push for growth increases and a likely half-point interest rate cut at their October meeting[10]. The EU, China, and Canada are all among the U.S.’s most important trading partners, and the health of those countries will go a long way to determining the potential for supply chain activity.
Of course, continued international trade with these countries relies heavily on the continued operation of U.S. ports, which is not as much of a sure thing at the end of September as supply managers would prefer. Port operators and carriers have appealed to the National Labor Relations Board (NLRB) to force the International Longshoreman’s Association (ILA) to begin negotiating a new contract before the current deal expires on October 1st. The ILA allegedly won’t come to the table until the ports agree to a 77% wage increase over the next six years – a level of pay that would dwarf the recent increase that West Coast dock workers recently gained[11]. It became clear during COVID-19 how much the U.S. economy relies on dockworkers, and the ILA is attempting to capitalize on what is expected to be the busiest peak season since 2021.
Over half of U.S. imports come in through East and Gulf Coast ports. If strikes occur and continue for a significant time, it will complicate Q4 supply chains. Loadstar data suggest that there are currently 39 container ships scheduled to arrive at the Port of New York/New Jersey in the first week of October. If they cannot be unloaded there, they may have to “port hop” to Canadian, Mexican, or West Coast ports. There are some limitations here, as Montreal dock workers are taking advantage of the turmoil at U.S. ports by planning a three-day walkout for the first week of October, limiting the alternate delivery options for carriers[12]. In the short run, it is also likely that many of them will idle outside of U.S. ports, hoping for the labor issue to be resolved quickly. With the potential for billions of dollars of inventory to be stranded and the toll that would take on costs and availability of goods during an election year, it can also not be ruled out that the Biden administration would step in to circumvent strikes in some key terminals were they to carry on for an extended period [13]. An extended strike would be particularly devastating for retailers that have attempted to move back to JIT models and may once again find themselves short on inventory heading into what should be a robust holiday season.
This uncertainty surrounding the ports is a primary reason Upstream Inventory Levels built up throughout the summer. As mentioned above, we finally see those inventories moving to retailers, as Downstream Inventory Levels are expanding (56.7) after three consecutive months of contraction. Overall, Inventory Levels are expanding at a robust rate of 59.8 as goods move from wholesalers and distributors to retailers. This growth has also driven Inventory Costs to grow, increasing (+2.3) to 71.3, which is the first time since February of 2023 that this metric has been above 70.0.
The interplay between Upstream and Downstream Inventory Levels provides insights into both the past and future of the logistics industry and overall economy. The chart below displays movements in Upstream (blue line) and Downstream (orange line) Inventory Levels from September 2022 to September 2024. There are a few key takeaways from this chart. The first is that Inventory Levels are lower in September 2024 than they were at the same time in 2022 but higher than in 2023. This shows that firms have been able to operate leaner than in 2022, when retailers were overstocked from COVID-19, but are also more confident than they were a year ago when fears of a recession were high and peak season demand did not materialize. We have reported throughout the summer that Upstream Inventory Levels were higher than their Downstream counterparts. It is now clear that those Upstream movements were foreshadowing corresponding movements Downstream. This likely represented firms getting products into the U.S. ahead of port strikes but waiting to move them to the retail level until the very end of Q3 as a way to maintain JIT practices. The fact that there has been excess available Transportation Capacity also likely made retailers feel more comfortable waiting longer to move goods, knowing that they could find affordable options to move them downstream. The current inventory trajectory suggests that retailers expect a healthy fourth quarter and holiday season. It will be interesting to continue monitoring these dynamics throughout the year to see if this comes to pass.
The effect of these Upstream inventories has been apparent in the demand for port-adjacent warehousing space. The most significant increase for metro areas from 2019-2023 is Savannah, GA, with 64.8% growth. There has also been robust growth in Olympia, Washington (52.7%). The Inland Empire is the traditional growth area for the Southern California ports and has added 84.1 million square feet of space over the last four years. However, limited space and the high cost of real estate in California have led to the proliferation of inland staging areas in western metro areas. This is reflected in Las Vegas, Phoenix, and Austin, all reporting more than 40% growth in distribution space from 2019-2023[14]. It is not only southwestern metros, though, as over 18 million square feet of new warehousing is planned for development in Long Island[15, allowing for increased service levels of e-commerce retailers in the largest metro area in the U.S. Despite all of this construction, the expansion rate of Warehousing Capacity has slowed (-3.7) to 55.9. Even with the slight growth in available capacity, Warehousing Utilization is up (+3.3) to 60.9, and so are Warehousing Prices (+3.2) at 66.9. This reading for Warehousing Prices is the highest since October of 2023 and provides additional evidence of the buildup of inventories and the subsequent need for a place to hold them.

We also see evidence of increasing inventories in the freight market. While the rate is down (-3.2), Transportation Prices expanded for the fifth consecutive month in September at 58.4. This is the longest continuous expansion stretch for Transportation Prices from late 2021 to early 2022. Further evidence of this increased demand comes from Transportation Utilization continuing to expand (-1.9) at a rate of 57.6. Increasing utilization has also pushed down available capacity, as Transportation Capacity is down (-6.7) to 50.0, indicating “no movement.” The capacity situation could change quickly with the port shutdowns. One of the things that made transportation so expensive in 2021 was the imbalance of freight capacity. The disproportionate volume of goods coming in through West Coast ports meant that trucks continually rushed back to Southern California to pick up expensive loads, leading to a capacity shortage in the other parts of the country. Freight capacity was re-balanced over the last two years as more volume shifted to East and Gulf Coast ports. A prolonged strike would likely push us back towards that imbalance, artificially depressing available Transportation Capacity and inflating Transportation Prices nationwide. This price growth is due to demand and not costs. The average price for U.S. Diesel Fuel was up $0.013 to $3.539/gallon in the last week of September, breaking a 10-week streak of declining prices and possibly reflecting the start of peak freight season.
Interestingly, fuel costs are down in almost all coastal regions (they are up a negligible 0.003/gallon in the Central Atlantic). Instead, this increase is driven by the Midwest, Rock Mountain, and Gulf Coast regions, suggesting that the inventory being held close to coastal ports is now moving to inland markets. Even with this slight increase, prices are down 1.047/gallon from the same time a year ago[16]
Respondents were asked to predict movement in the overall LMI and individual metrics 12 months from now. Respondents grew increasingly optimistic in September, predicting expansion in the overall index at a rate of 65.4, which would be slightly above the all-time average of 61.8. This growth is anticipated to be driven by Inventory Levels expanding at a rate of 61.0. This robust rate of Inventory Level growth is predicted to cascade outwards, driving forecasted Inventory Costs (70.9, Warehousing Prices (70.7), and Transportation Prices (80.0) up to significant levels of growth. The reading of 80.0 for Transportation Prices would be the highest since early 2022 and signal a move back to a full-fledged freight boom – backed up by the predicted contraction of 44.2 for Transportation Capacity.