February 2025 Logistics Manager’s Index Report® LMI® at 62.8
Growth is INCREASING AT AN INCREASING RATE for: Inventory Levels, Inventory Costs, Warehousing Utilization, Warehousing Prices, and Transportation Capacity.
Growth is INCREASING AT A DECREASING RATE for: Warehousing Capacity, Warehousing Utilization, Transportation Utilization, and Transportation Prices.
The February 2025 Logistics Manager’s Index reads in at 62.8, up (+0.8) from January’s reading of 62.0. For the second consecutive month, this is the fastest reading of expansion in the overall index since June of 2022.
The positive movement in the overall index was driven by the continuing expansion of Inventory Levels, which were up (+6.3) to 64.8 in February, which is the fastest rate of expansion for this metric since June of 2022 (which is the last time that the overall index was higher than it is now). So far 2025 stands in stark contrast to the more JIT inventory patterns of 2024 when average Inventory Level growth was a lean 52.7. It is likely that this increase has been at least partially driven by continually shifting trade policies. The spike in inventories has led to increased rates of expansion for Inventory Costs (+7.1 to 77.3), Warehousing Prices (+4.0 to 77.0). Both of these are reading in at their fastest rate of expansion in several years as supply chains strain to shoulder both the volume and velocity of inventory that poured across U.S. borders in January and early February as firms attempted to avoid costs associated with potential tariffs. Further evidence that supply chains are straining is Warehousing Capacity dipping (-1.2) to 50.5, which is on the verge of contraction. Interestingly, transportation metrics slowed in February, with Transportation Capacity increasing (+2.5 to 55.1) while the expansion of Transportation Utilization (-2.3 to 57.8) and Transportation Prices (-4.9 to 65.5) decreased. As will be discussed below, the loosening of Transportation Capacity mostly happened in late February, which could suggest that inventory was built up quickly, but has become somewhat static in the last two weeks are firms and consumers have become concerned about the potential cost ramifications of a potential trade war.
Researchers at Arizona State University, Colorado State University, Florida Atlantic University, Rutgers University, and the University of Nevada, Reno, and in conjunction with the Council of Supply Chain Management Professionals (CSCMP) issued this report today.
Results Overview
The LMI score is a combination of eight unique components that make up the logistics industry, including inventory levels and costs, warehousing capacity, utilization and prices, and transportation capacity, utilization, and prices. The LMI is calculated using a diffusion index, in which any reading above 50.0 indicates that logistics is expanding; a reading below 50.0 is indicative of a shrinking logistics industry. The latest results of the LMI summarize the responses of supply chain professionals collected in February 2025.
The LMI read in at 62.8 in February, up slightly (+0.8) from January’s reading of 62.0. Similar to January, there is no major distinction by supply chain positions, as both Upstream (64.2) and Downstream (64.2) firms reported steady growth[1]. As mentioned above, this is the fastest rate of expansion in the overall index in nearly three years, and marks two consecutive readings above the all-time index average of 61.7, a significant change after readings have been below this level for the previous 30 months. This growth is mainly attributable to expansions in inventories and the associated costs. While the economy is still expanding, is a somewhat uncertain time in terms of potential shifts to trade regulations. The buildup of inventories is a shift away from the lean just-in-time (JIT) practices that had characterized 2024. JIT was prevalent in 2024 because supply chains were at their most stable level since 2020, and flows of goods have become somewhat predictable. This predictability has shifted due to uncertainty regarding global trade regulations and tariffs.
It is a fluid situation, but at the moment uncertainty surrounding tariffs remains elevated. In the last week of February President Trump announced that the 25% tariffs on Mexico and Canada (which would have a carve out for 10% duties on energy imports) that were discussed last month, along with further plans to double the existing 10% tariffs on imports from China, may be implemented on March 4th (the day this report is released)[2]. The possibility of further “reciprocal tariffs” on any country that places tariffs on U.S. goods has also been floated for implementation in early April[3]. At the time of this writing, it remains to be seen whether or not these tariffs will actually be implemented. In both the current and previous Trump administrations the threat of punitive tariffs were used as negotiation tactics. If all of the threatened tariffs were to be implemented, along with the recently imposed duties on steel and aluminum, the total additional cost would be approximately $250 billion if volumes remained consistent year-over-year[4],[5]. An additional cost associated with tariffs are the increased credit terms that importers will need to have with their import brokers. This is because the mechanism through which tariffs are paid at the border sometimes involves the broker paying potential duties on behalf of their clients[6].
However, even if tariffs are not put into place, the uncertainty has clearly already had an effect. The mere possibility of tariffs has been enough to drive a spike Canadian businesses inquiries to Canada’s export credit agency about the potential for shipping goods to markets outside the U.S. There are normally 30,000 to 40,000 such requests per period. That number shot up to over a million requests in the most recent period, suggesting that Canadian firms are looking to diversify away from their dependence on the U.S. market[7]. Many Chinese firms are taking a different approach, either rapidly increasing production[8] or looking to move their production to nearby countries like Vietnam or Malaysia that have not been targeted by tariffs[9]. The uncertainty has impacted domestic measures of the economy as well. U.S. consumer sentiment slowed to 64.7 in February. This is down 9.8% from January’s reading of 71.7 and 15.9% lower than the same time last year when consumers were (falsely) hopeful that interest rates would be coming down soon. The decline in sentiment was consistent across age and income groups, with respondents pointing to prices increases stemming from tariffs as one of the factors behind their souring mood. This is reflected in year-over-year inflation expectations increasing a full point to 4.3%. This marks two consecutive months of large jumps in inflation expectation and is the highest rating for this index since November 2023[10]. Overall, U.S. economic activity slowed as well, with the Chicago Fed National Activity Index dropping to -0.03 (any number below zero means contraction). This decrease was due to declining levels or personal consumption, production, and a slower housing market[11].
Again, at the moment the U.S. economy is strong – especially relative to the world’s other leading economies. The current uncertainty has, however, led to a few warning lights. For instance, the February Flash PMI suggested that U.S. business growth slowed sharply in February. This is a change of pace from 2024, when the U.S. consistently reported stronger economic growth than any other developed country[12]. Commerce Department released on the last day of February backs this up, showing that U.S. consumer cut spending by 0.2% in January, which is the deepest decline for this metric since February 2021. Overall, retail sales were down 0.9% for the month, which is a deeper decline than what had been expected[13]. This all has led the Atlanta Federal Reserve to go so far as to predict that the economy may shrink at a rate of 1.5% in Q1 of 2025. It should be noted that this prediction is an outlier, but there is some level of consensus that even if there is growth, it will be lower than the 2.3% expansion the U.S. experienced in the final quarter of 2024[14]. February was an overall losing month in the major U.S. stock indices. This was led by a 4% decline in the tech-heavy Nasdaq, a 1.4% drop in the S&P, and 1.6% dip in the Dow. The Cboe Volatility Index, which gauges “fear” on Wall Street, was up in late February as well[15]. There is some fear that this may continue, as 47.3% of individual investors reported expectations of falling stock values in a recent American Association of Individual Investors survey. Uncertainty regarding the impact of tariffs was a primary driver behind this turn towards pessimism[16]. It is also worth noting that the yield curve inverted in February, with the value of a 10-year treasury note falling below the value of a 3-month note. While this type of change has foreshadowed a recession in the past, a similar inversion occurred in October 2022, and there was no recession[17]. However, there was a freight recession during this period. It will be interesting to observe whether or not this inversion foreshadows any negative movements in freight over the next 12 months.
As is often the case, we see inventories acting as the buffer against uncertainty. Inventory Levels were up (+6.3) again in February, reading in at 64.8. This increase led to an even larger spike (+7.1) in Inventory Costs, which were up to 77.3 in February. This is the highest reading for either of our inventory metrics since October 2022. The volume of goods flowing into the country is reflected in activity at the ports. Imports into the Ports of Los Angeles and Long Beach totaled 952,733 TEUs in January, which is up 41.4% year-over-year[18]. This volume is unlikely to continue as more tariffs (particularly on China) are implemented. This is evidenced by the 24.6% year-over-year drop of imports moving through the Port of Los Angeles in the final week of February[19]. We observe similar dynamics when splitting out inventory readings from early (2/-2/14) to late (2/15-2/28) February. Expansion in Inventory Levels slowed down from 69.6 to 60.0, while Inventory Cost expansion increased significantly from 71.1 early in the month to 82.7 later on. As will be expanded on below, this dynamic suggests that a lot of inventory came in early, before Chinese tariffs were implemented, but have grown more static post-tariffs, leading to increased holding costs.
This activity has been made more complex for importers due to the quickly-changing rules of U.S.-China trade. A new proposal being considered would levy a fee of $1.5 million on Chinese or Chinese-flagged ships that make deliveries at U.S. ports[20]. On the other hand, the U.S. did remove tariffs on Chinese de minimis shipments (which are imports valued at less than $800) due to the difficulty associated with soring and approving packagers. There are however plans to resume duties on those once sufficient systems are in place to deal with the estimated $50 billion in de minimis shipments that flow from China to the U.S.[21]. It is not all bad changes at ports. Goods will continue to flow smoothly into U.S. ports through the near future as East and Gulf Coast dockworkers approved a labor deal with the ports that will include a 62% increase in pay as well as cap on automation that extends through 2030[22].
Looking more globally, there was an increase in tensions at the Panama Canal in early February when the U.S. State Department issued a statement suggesting that U.S. government vessels would no longer be charged to move through the canal. The Panamanian President denied this, pointing out that giving preferential treatment to one nation over another could lead to legal challenges. The visit from Secretary of State Rubio did however lead to Panama officially opting out of China’s Belt-and-Road Initiative, a move that the administration sees as key to ensuring the independence of one of the most important components of global shipping infrastructure from Chinese influence[23]. On the other side of the world, the head of the Suez Canal stated that they expect vessel traffic to return to normal by Spring due to the cease-fire in the Middle East. This will be a welcome return, as the revenues generated by the canal were down 60% in 2024[24]. Warehousing Capacity expansion declined (-1.2) to 50.5, which is just above the break-even level of 50.0. This metric has already moved into contraction for Upstream firms at 46.6. It expanded moderately at 55.3 for Downstream retailers. One of the major sources of tightness in the warehousing market is with smaller facilities. According to a report from Cushman& Wakefield, the vacancy rate at smaller facilities is scarce; with only 2.9% vacancy at facilities that are smaller than 50,000 square feet and 4.9% vacancy at facilities between 50,000 to 100,000 square feet. This paucity stands in stark contrast to the relative abundance of availability of super-sized facilities, with warehouses that are 500,000 square feet or larger sitting at 11% vacancy. This discrepancy may shift, as facilities sized between 100,000 to 300,000 square feet were far and away the most-built warehouse type in Q4 of 2024[25]. The shortage of smaller-footprint warehouses is partially a reflection of the push to build large facilities meant to handle increasing levels of e-commerce. However, as more retailers have pushed to locate facilities closer to consumers to improve service offerings, smaller, more urban warehouses have become more desirable. They are also more affordable and reasonable for smaller firms that are not operating at the same capacity as larger firms. This is reflected in our numbers as well, as smaller respondents reported a contraction of available Warehousing Capacity at 45.5. This is statistically significantly lower than the mild expansion of 54.8 that was reported by larger respondents.
Warehousing Capacity beginning to tighten now would represent a shift as it had previously only contracted once in the last two years (it was March 2024). The relative looseness of capacities allowed for slower increases in Warehousing Prices and Warehousing Utilization. Utilization is still relatively steady, with the rate of expansion declining (-2.8) to 65.5 and back towards more “normal” levels of growth. Warehousing Prices are a different story, as they are up (+4.0 ) to 77.0, which is their fastest rate of expansion since June of 2022. Warehousing Prices had grown at an incredibly stable rate, reading in between 643.0-67.0 in 10 of 11 months from November 2023 to October 2024. Since then however, Warehousing Prices have exhibited stead growth; even within the month of February where they went from 67.4 early in the month to the astronomical expansion rate of 85.6 in the second half of the month.
A clear pattern emerges when looking at movements in Inventory Levels and the related cost metrics over the first two months of the year. In the chart below we split out shifts in Inventory Levels (pink line, with values displayed), Inventory Costs (green line), and Warehousing Prices (blue line) in the first and second halves of January and February. A clear pattern emerges here, where Inventory Level growth peaked in late January and early February as firms replenished inventories post-holiday and attempted to stay ahead of potential tariffs. The late February responses were collected after the latest round of tariffs on China had been implemented, at which point we see Inventory Level growth slow back to 60.6 (which is still a higher rate than what we saw for most of last year). Normally, we would expect that when Inventory Level growth decreases that associated costs would slow as well. We saw the opposite in late February, as growth in Inventory Costs and Warehousing Prices exploded to 82.7 and 85.6 respectively. These rapid rates of expansion likely indicates that firms are holding these high levels of inventory static and will slowly sell through them over time, which will put considerable pressure on available capacity (Warehousing Capacity read in at 50.0 in late February). This represents a move away from the JIT-centric approach that characterized 2024, and a move back towards the just-in-case (or JIC) policies of 2021. This is the first time that either of these metrics has read in above 80.0 since the summer of 2022 at the height of inflation. JIC inventory practices and the associated supply costs were a major contributor to the inflation of 2021 and 2022. It will be critical to continue tracking movements in these metrics as there is a possibility that continuing at the trajectories we display below could lead to a comeback in inflation.

While the movements in our transportation metrics were less dramatic than what we saw elsewhere in the report, they still offer some insight into the current state of logistics and the overall economy. Potential tariffs could have a substantial impact on transportation markets, as imports make up a significant portion of freight volume. For instance, in 2024, $203.1 billion of goods was moved into the U.S. from Canada and Mexico by rail[26]. Staying on rail, BNSF reported pre-tax profits of $6.64 billion in 2024, which is up 0.5% year-over-year. Intermodal movement of consumer products made up a larger portion of volume, as it increased 16.2% year-over-year[27], reflective of both JIT practices and increased consumer spending over the period. It will be interesting to continue monitoring the intermodal and rail markets. The Association of American Railroads reported that volume was down 5.1% year-over-year in the last week of February. Traffic is down 2.4% overall through the first eight weeks of the year, with much of this due to an 8.3% drop in volume crossing over form Mexico[28].
FreightWaves’ tender rejection index read in at 5.7% in mid-February. This is up from last Fall and, according to friend of the report[29] Zach Strickland, this suggests that excess capacity has continued to absorb any increases in demand[30]. This is consistent with our Transportation Capacity metric, which has not moved into contraction in since March of 2022 three years ago. There is no indication that contraction is imminent at this point, as Transportation Capacity actually expanded (+2.5) at a rate of 55.1. Capacity expansion increased as we moved through February, increasing from the relatively meager expansion of 51.9 early to a more robust 58.2 in the second half of the month. Because of this constant rate of moderate expansion, the majority of firms have been able to locate capacity when needed, which has kept Transportation Prices from spiking. The loosening of capacity seems to have manifested in Transportation Price expansion slowing (-4.9) to 65.5. January’s reading of 70.4 was the highest in nearly three years. Expanding at 65.5 and having price expansion come in 10 points higher than capacity expansion suggests that the freight market is still moving in an overall positive direction. Diesel prices increased to $3.697 per gallon in the last week of February. This is up 2 cents from a week ago, but is still 36 cents lower per gallon than the same period last year[31]. Finally, we see that Transportation Utilization expansion slowed (-2.3) to 57.8. This breaks a streak of three consecutive readings above 60.0 and represents the lowest reading for this metric since July 2024. It seems unlikely to remain that way, however, as respondents from both sides of the supply chain predict expansion over the next year. Downstream firms were marginally more optimistic, predicting expansion at 70.5 to 61.8 for their Upstream counterparts and suggesting that the freight market is more likely to tighten for retailers than for their upstream supply chain partners.
Respondents were asked to predict movement in the overall LMI and individual metrics 12 months from now. Respondents continued to predict expansion in February, with the year-out forecast for the overall index coming in at 66.2, which is consistent (+0.1) with January’s future prediction of 66.1. This is largely driven by the anticipation that Inventory Levels will continue to increase at a rate of 69.1. As a consequence of this, respondents are also predicting that all of the cost metrics will grow with Inventory Costs (80.2), Warehousing Prices (78.4), and Transportation Prices (76.8) readings all indicating significant rates of expansion. In aggregate, the predicted expansion rate for our cost/price metrics comes out to 235.6. In the past, aggregate cost/price readings above 240.0 have been somewhat inflationary, it will be critical to continue monitoring movements in these metrics over the next year to observe whether or not the levels are actually reached.

Similar to January, we see very little difference when comparing feedback from Upstream (blue bars) and Downstream (orange bars) respondents in February. The only exception is the marginally statistically significant difference we see in Inventory Levels, where Upstream came in 11.1 points higher than their Downstream counterparts at a rate of 69.6 to 58.5. This is likely reflective of expanded inventories being held Upstream at wholesalers and Distributors. This is a similar dynamic to what we observed last year, when retailers ran fairly lean themselves while their suppliers held onto high levels of goods. While the dynamic is the same, it is worth pointing out that the overall levels of expansion are elevated from what we saw a year ago. Related to this, we see that once again Upstream firms are reporting contracting Warehouse Capacity (46.6) while Downstream firms report mild expansion (55.3). The difference is just short of being statistically significant, but the directionality does suggest a difference in available space that is likely due to the difference in Inventory Levels. Other than that, activity remained fairly steady across the different levels of the supply chain.

| Inv. Lev. | Inv. Costs | WH Cap. | WH Util. | WH Price | Trans Cap | Trans Util. | Trans Price | LMI | |||||||||||
| Upstream | 69.6 | 76.4 | 46.6 | 62.9 | 76.7 | 53.0 | 59.4 | 64.5 | 64.2 | ||||||||||
| Downstream | 58.5 | 78.0 | 55.3 | 69.5 | 78.4 | 59.0 | 55.1 | 67.5 | 63.7 | ||||||||||
| Delta | 11.1 | 1.7 | 8.7 | 6.6 | 1.7 | 6.0 | 4.3 | 3.0 | 0.5 | ||||||||||
| Significant? | Marginal | No | No | No | No | No | No | No | No |
According to future predictions reported by Upstream (green bars) and Downstream respondents (purple bars) it is possible that these differences will not hold. Interestingly, the current difference in Inventory Levels is expected to disappear (69.1 to 68.3). However, Upstream firms continue to predict contraction in Warehousing Capacity (47.4), but now at a significantly lower rate than the expansion (64.5) predicted by Downstream firms. We also observe a difference in Transportation Utilization, with Downstream firms predicting marginally higher expansion at a rate of 70.5 to 61.8 for Upstream. It is interesting that the higher prediction of Downstream utilization comes despite Upstream firms predicting a slight contraction in Transportation Capacity (49.3) while Downstream firms predict mild expansion (56.4).

| Futures | Inv. Lev. | Inv. Costs | WH Cap. | WH Util. | WH Price | Trans Cap. | Trans Util. | Trans Price | LMI |
| Upstream | 69.1 | 79.6 | 47.4 | 64.0 | 76.3 | 49.3 | 61.8 | 76.8 | 65.4 |
| Downstream | 68.3 | 80.5 | 64.5 | 70.7 | 81.1 | 56.4 | 70.5 | 76.3 | 67.4 |
| Delta | 0.8 | 0.9 | 17.1 | 6.7 | 4.8 | 7.1 | 8.7 | 0.6 | 2.0 |
| Significant? | No | No | Yes | No | No | No | Marginal | No | No |
Many of the dynamics at play between early (gold bars) and late (green bars) February feedback was discussed above. In early February (2/1-2/14), Inventory Levels grew at the elevated rate of 69.6 before slowing down slightly to 60.0 (which is still high) in late February (2/15-2/28). This contrasts with the expansion we saw in Inventory Costs (71.1 early to 82.7 late) and Warehousing Prices (67.4 early to 85.6 late). We also saw a marginally significant increase in available Transportation Capacity (51.9 early to 58.2 late) which suggests that the freight market loosened up later in the month. When taken altogether, this suggests that inventories built up quickly earlier in the month pre-tariffs but then slowed later post-tariffs. That inventory is now being held in a stretched and somewhat expensive warehousing network. Because the inventory is largely static (particularly Upstream), transportation activity has slowed, loosening available capacity.

| Inv. Lev. | Inv. Costs | WH Cap. | WH Util. | WH Price | Trans Cap | Trans Util. | Trans Price | LMI | |
| 2/1-2/14 | 69.6 | 71.1 | 51.1 | 69.1 | 67.4 | 51.9 | 56.6 | 66.7 | 62.2 |
| 2/15-2/28 | 60.6 | 82.7 | 50.0 | 62.3 | 85.6 | 58.2 | 58.9 | 64.3 | 65.5 |
| Delta | 9.0 | 11.6 | 1.1 | 6.9 | 18.2 | 6.3 | 2.3 | 2.4 | 3.2 |
| Significant? | Yes | Marginal | No | No | Yes | Marginal | No | No | No |
We also compare smaller firms (those with 0-999 employees, represented by maroon lines) to larger firms (those with 1,000 employees or more, represented by gold lines) in February. The readings are similar across many of the metrics. However, smaller firms do report significantly tighter Warehousing Capacity, reporting contraction (45.5), which contrasts with the mild expansion (54.8) reported by larger firms. While it is not significant, smaller firms also report a faster rate of expansion in Inventory Levels (68.6 to 62.0) which is likely behind the constrained space. There have been anecdotal reports of smaller firms bringing in greater levels of inventory to avoid potential cost increases from tariffs. There are surely other factors at play; but taken together, these readings could lend support to that argument.

| Employees | Inv. Lev. | Inv. Costs | WH Cap. | WH Util. | WH Price | Trans Cap. | Trans Util. | Trans Price |
LMI |
| 0-999 | 68.6 | 73.8 | 45.5 | 70.5 | 73.9 | 54.1 | 55.1 | 65.0 | 63.2 |
| 1,000+ | 62.0 | 79.6 | 54.8 | 61.8 | 78.8 | 55.3 | 59.3 | 65.3 | 63.6 |
| Delta | 6.6 | 5.8 | 9.4 | 8.6 | 5.0 | 1.2 | 4.2 | 0.3 | 0.4 |
| Significant? | No | No | Marginal | No | No | No | No | No | No |
The index scores for each of the eight components of the Logistics Managers’ Index, as well as the overall index score, are presented in the table below. The rate of expansion for the overall index is 62.8 which is up (+0.8) from January’s reading of 62.0. This is the fastest rate of expansion for the overall index since June 2022, which is the second month in a row that has happened. The increasing rate of growth is driven by continued expansion of Inventory Levels (+6.3), which led to subsequent increases in Inventory Costs (+7.1) and Warehousing Prices (+4.0), as well as slowing rates of growth for Warehousing Capacity (-1.2) which at 50.5 is just above the break-even rate of 50.0. Interestingly, all three transportation metrics came in with slightly slower rates of change than last month, suggesting that the influx of inventories is somewhat stagnant and not turning over very quickly.
| LOGISTICS AT A GLANCE | |||||
| Index | February 2025 Index | January 2025 Index | Month-Over-Month Change | Projected Direction | Rate of Change |
| LMI® | 62.8 | 62.0 | +0.8 | Expanding |
Faster |
| Inventory Levels | 64.8 | 58.5 | +6.3 | Expanding | Faster |
| Inventory Costs | 77.3 | 70.2 | +7.1 | Expanding | Faster |
| Warehousing Capacity | 50.5 | 51.7 | -1.2 | Expanding | Slower |
| Warehousing Utilization | 65.5 | 68.3 | -2.8 | Expanding | Slower |
| Warehousing Prices | 77.0 | 73.1 | +4.0 | Expanding | Faster |
| Transportation Capacity | 55.1 | 52.6 | +2.5 | Expanding | Faster |
| Transportation Utilization | 57.8 | 60.1 | -2.3 | Expanding |
Slower |
| Transportation Prices | 65.5 | 70.4 | -4.9 | Expanding |
Slower |
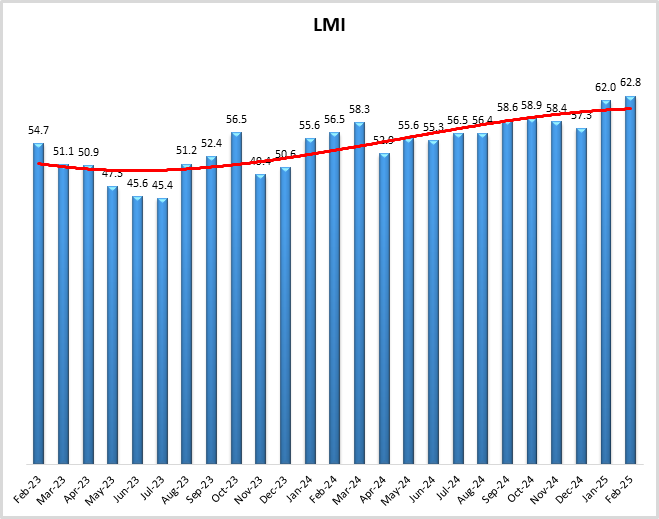
Historic Logistics Managers’ Index Scores
This period’s along with prior readings from the last two years of the LMI are presented table below:
| Month | LMI | Average for last 3 readings – 60.7
All-time Average – 61.7 High – 76.2 Low – 45.4 Std. Dev – 7.94
|
| Feb ‘25 | 62.8 | |
| Jan ‘25 | 62.0 | |
| Dec ‘24 | 57.3 | |
| Nov ‘24 | 58.4 | |
| Oct ‘24 | 58.9 | |
| Sep ‘24 | 58.6 | |
| Aug ‘24 | 56.4 | |
| July ‘24 | 56.5 | |
| June ‘24 | 55.3 | |
| May ‘24 | 55.6 | |
| Apr ‘24 | 52.9 | |
| Mar ‘24 | 58.3 | |
| Feb ‘24 | 56.6 | |
| Jan ‘24 | 55.6 | |
| Dec ‘23 | 50.6 | |
| Nov ‘23 | 49.4 | |
| Oct ‘23 | 56.5 | |
| Sep ‘23 | 52.4 | |
| Aug ‘23 | 51.2 | |
| July ‘23 | 45.4 | |
| June ‘23 | 45.6 | |
| May ‘23 | 47.3 | |
| Apr ‘23 | 50.9 | |
| Mar ‘23 | 51.1 | |
| Feb ‘23 | 54.7 |
LMI®
The overall index reads in at 62.8 in February, up slightly (+0.8) from January’s reading of 62.0. Like January, this is the highest reading for the overall index since June of 2022. This reading is up 6.3 points from last February and 8.1 points up from the reading two years ago. This marks two consecutive months that the LMI has come in above the overall average of 61.7. This is a marked shift as the index had come in below this level for the previous 30 months. The increase in the overall index is driven by continued increases in Inventory Levels and the associated expansion of costs and contraction of capacity. The expansion was consistent across our respondents, with no significant differences in the overall index by size, time of the month, or supply chain position.
When asked to predict what conditions will be over the next 12 months, respondents foresee a rate of expansion of 66.2, up very slightly (+0.1) from January’s future prediction of 66.1. , This is sentiment shared across all levels of the supply chain, as Upstream and Downstream firms both predict robust rates of expansion at 64.2 and 63.7 respectively.

Inventory Levels
The Inventory Levels index is 64.8, up (+6.3) from January’s reading of 58.5. Taking the movements from January and February together, Inventory Levels are up 14.8 points so far in 2025. Inventory Levels are 6.3 points higher than a year ago, and 2.4 points higher than two years ago at this time. Much of this increase happened earlier in February as early respondents returned 69.6, later returned 60.6. Later respondents reported an increase, but not as great. As tariffs were implemented, the increase in Inventory Levels decreased.
Upstream respondents returned a value of 69.6, while Downstream respondents returned a 58.5. Last month, Upstream respondents reported greater growth in inventory by 4.4 points. This month, Upstream is higher by 11.1 points. This month small firms again reported greater inventory growth, by 6.6 points. Small firms reported significant inventory growth at 68.6, while larger firms also reported strong inventory growth at 62.0.
When asked to predict what conditions will be like 12 months from now, the average value is 69.1, up (+5.0) from January’s future prediction of 64.1. Respondents are predicting similar levels of growth across the supply chain with Upstream coming in at 69.1 and Downstream at 68.3 marking a further departure from the principles of JIT that characterized 2024.

Inventory Costs
Inventory costs read in at 77.3, up (7.1) from January’s reading of 70.2. When combined with movements in January, Inventory Costs are up 15.7 points in 2025, which marks a significant expansion in costs. The current value is 14.4 points higher than last year at this time, and 6.4 points higher than two years ago. This is happening across the supply chain, with readings of 76.4 for Upstream and 78.0 for Downstream, indicating that both groups of respondents are seeing significant increases in inventory costs. Early respondents reported significantly greater increases in inventory levels (69.6 vs 60.6), but later respondents reported significantly greater increases in inventory costs (82.7 vs 71.1). Taken together, this suggests that inventories were rushed in during the first half of the month and now are being stored at a high cost. Large firms reported greater Inventory Costs increases, by 5.8 points (79.6 vs 73.8). This stands in contrast to smaller firms reporting greater Inventory Levels increases by 6.6 points (68.6 vs 62.0). This might suggest that smaller firms were among those rushing to import goods to avoid tariffs, while some larger firms may have been forced to absorb greater costs, potentially due to greater order sizes
Predictions for future Inventory Cost growth is 80.2, up significantly (+10.4) from January’s future prediction of 69.8 and suggesting that the costs of storing additional inventories may put a strain on existing supply chain infrastructure. Expectations of high costs are fairly uniform across the supply chain, as Upstream future predictions averaged 79.6 and Downstream read in almost identically at 80.5. When taken altogether LMI respondents are clearly signaling that they believe costs will likely be elevated significantly in 2025.

Warehousing Capacity
Continuing last month’s decrease in capacity, the reading for February’s Warehousing Capacity index decreased by 1.2 points, and remained in expansionary territory (50.5), though is fast approaching the 50-point mark for the first time since March of 2024. Though, this metric has remained above 50 since. This reading is down 1.7 points from the reading one year ago, and also down 6.1 points from the reading two years ago. In addition, there was an 8.7-point split between Upstream (46.6) and Downstream (55.3) which was not statistically significant (p>.1), yet quite interesting, as the Upstream value has dipped into contractionary territory in this reading, now for the second month in a row. Comparing the differences between small (<999 employees) and large (>999) employees we see that these values are 45.5 and 54.8, respectively, with the small firm value registering in contractionary territory. This 9.4-point split was marginally statistically significant (p <.1).
Finally, exploring the future predictions for this value we see that Warehouse Capacity, both Downstream and Upstream, are expected to remain in expansionary territory one year out at 54.7, up (+1.0) from January’s future prediction of 53.7. In this case, and with a reversal from last month, future Upstream expectations for Upstream are expected to dip into in contraction at 47.7 whereas Downstream’s future prediction is expected to come in at 64.5. This 17.1-point difference was statistically significant (p<.05).

Warehousing Utilization
The Warehousing Utilization index registered in at 65.5 points for the month of February 2025, reflecting a 2.8-point decrease from the month prior. This reading is down just under a point (.8) from the reading one year ago, and also down 4.8 points from the reading two years ago. In addition, there was a 6.6-point split between Upstream (62.9) and Downstream (69.5) which was not statistically significant (p>.1). Comparing the differences between small (<999 employees) and large (>999) employees we see that these values are 70.5 and 61.8, respectively. This 8.6-point split was not statistically significant (p >.01).
Finally, exploring the future predictions for this value we see that Warehouse Utilization is expected to continue to stay in expansionary territory one year out at 67.2, down (-2.5) from January’s future prediction of 69.7. This is consistent across the supply chain with future Upstream expectations (64.0) being predicted to be similarly high to Downstream expectations (70.7), with the difference between these two widening from last month, and where this 6.7-point difference is not statistically significant (p>.1).

Warehousing Prices
The Warehousing Price index registered in at 77 points for the month of February 2025, which is up 3.9 points from the month prior, continuing the increase now for the third month in a row. This reading is up rather substantially from the reading one year ago (by 12.8 points), and also up 3.7 points from the reading two years ago. In addition, there was a 1.7-point split between Upstream (76.7) and Downstream (78.4) which is not statistically significant (p>.1). Comparing the differences between small (<999 employees) and large (>999) employees we see that these values are 73.9 and 8.8 reflecting a 5.1-point difference between the two which was not statistically significant (p >.1).
Finally, exploring the future predictions for this value we see that Warehouse Prices are expected to continue to stay in expansionary territory one year out at 78.4 up (+3.6) from January’s future prediction of 74.8. This is consistent across the supply chain with future Upstream expectations (76.3) being predicted to be increasing at a slower rate than Downstream expectations (81.1). This 4.8-point difference was not statistically significant (p>.1).

Transportation Capacity
The Transportation Capacity Index moved up to 55.1 in February 2025. This constitutes an increase of 2.5 points from last month’s reading. As such, the upward movement of the Transportation Capacity index seems to have resumed, reaching the highest point recorded over the past six months. There is no significant difference between Upstream and Downstream, with Upstream Transportation Capacity index at 53.0 and the Downstream index at 59.0. As such, the slight expansion trend in Transportation Capacity remains present both Upstream and Downstream, across the supply chains.
The future Transportation Capacity index is now at 51.9, indicating expectations of a slightly increasing Transportation Capacity over the next 12 months. While the Upstream index remains below the threshold indicating contraction at 49.3, the Downstream Transportation Capacity index is at 56.4, indicating expectations of expansion over the next 12 months. However, this difference is not statistically significant.

Transportation Utilization
The Transportation Utilization Index decreased again, indicating 57.8 in February 2025. As such, the Transportation Utilization index continues its retreat with a second consecutive drop. The Downstream Transportation Utilization Index is now at 55.1, while the Upstream index is indicating 59.4. However, the difference is not statistically significant.
The future Transportation Utilization Index drops 8.3 points from last month, still indicating expansion at 64.8 for the next 12 months. The future Upstream Transportation Utilization index is at 61.8 while the Downstream index is at 70.5, but the difference is only marginally significant.

Transportation Prices
The Transportation Prices Index came back down to 65.5 in February 2025, which corresponds to a decrease of 4.9 points from the previous month, retreating from recent highs. While the Upstream Transportation Prices Index is at 64.5, the Downstream index is at 67.5, yet the difference is not statistically significant. As such, it can be concluded that although slightly weaker than last month, the inflationary pressures on Transportation Prices is still present across the supply chain.
The future index for Transportation Prices also retreats to 76.8, however it is still indicating strong expectations of higher Transportation Prices in the next 12 months. The Downstream future Transportation Prices index is at 76.3 while the Upstream Transportation Prices index is at 76.8, but the difference is not statistically significant.